Friday, May 31, 2013

Distributing the Edit History of Wikipedia Infoboxes


Aside from its value as a general-purpose encyclopedia, Wikipedia is also one of the most widely used resources to acquire, either automatically or semi-automatically, knowledge bases of structured data. Much research has been devoted to automatically building disambiguation resources, parallel corpora and structured knowledge from Wikipedia. Still, most of those projects have been based on single snapshots of Wikipedia, extracting the attribute values that were valid at a particular point in time. So about a year ago we compiled and released a data set that allows researchers to see how data attributes can change over time.

Figure 1. Infobox for the Republic of Palau in 2006 and 2013 showing the capital change.

Many attributes vary over time. These include the presidents of countries, the spouses of people, the populations of cities and the number of employees of companies. Every Wikipedia page has an associated history from which the users can view and compare past versions. Having the historical values of Infobox entries available would provide a historical overview of change affecting each entry, to understand which attributes are more likely to change over time or have a regularity in their changes, and which ones attract more user interest and are actually updated in a timely fashion. We believe that such a resource will also be useful in training systems to learn to extract data from documents, as it will allow us to collect more training examples by matching old values of an attribute inside old pages.

For this reason, we released, in collaboration with Wikimedia Deutschland e.V., a resource containing all the edit history of infoboxes in Wikipedia pages. While this was already available indirectly in Wikimedia’s full history dumps, the smaller size of the released dataset will make it easier to download and process this data. The released dataset contains 38,979,871 infobox attribute updates for 1,845,172 different entities, and it is available for download both from Google and from Wikimedia Deutschland’s Toolserver page. A description of the dataset can be found in our paper WHAD: Wikipedia Historical Attributes Data, accepted for publication at the Language Resources and Evaluation journal.

What kind of information can be learned from this data? Some examples from preliminary analyses include the following:
  • Every country in the world has a population in its Wikipedia attribute, which is updated at least yearly for more than 90% of them. The average error rate with respect to the yearly World Bank estimates is between two and three percent, mostly due to rounding.
  • 50% of deaths are updated into Wikipedia infoboxes within a couple of days... but for scientists it takes 31 days to reach 50% coverage!
  • For the last episode of TV shows, the airing date is updated for 50% of them within 9 days; for for the first episode of TV shows, it takes 106 days.

While infobox attribute updates will be much easier to process as they transition into the Wikidata project, we are not there yet and we believe that the availability of this dataset will facilitate the study of changing attribute values. We are looking forward to the results of those studies.

Thanks to Googler Jean-Yves Delort and Guillermo Garrido and Anselmo Peñas from UNED for putting this dataset together, and to Angelika Mühlbauer and Kai Nissen from Wikipedia Deutschland for their support. Thanks also to Thomas Hofmann and Fernando Pereira for making this data release possible.

Helping passwords better protect you

Knowing how to stay safe and secure online is important, which is why we created our Good to Know site with advice and tips for safe and savvy Internet use. Starting today, we'll also be posting regularly with privacy and security tips. We hope this information helps you understand the choices and control that you have over your online information. -Ed.

It could be your Gmail, your photos or your documents—whatever you have in your Google Account, we work hard to make sure it’s protected from would-be identity thieves, other bad guys, or any illegitimate attempts to access your information.

But you can also help keep your information safe. Think of how upset you would be if someone else got access to your Google Account without your permission, and then take five minutes to follow the steps below and help make it more secure. Let’s start with the key to unlocking your account—your password:

1. Use a different password for each important service
Make sure you have a different password for every important online account you have. Bad guys will steal your username and password from one site, and then use them to try to log into lots of other sites where you might have an account. Even large, reputable sites sometimes have their password databases stolen. If you use the same password across many different sites, there’s a greater chance it might end up on a list of stolen passwords. And the more accounts you have that use that password, the more data you might lose if that password is stolen.

Giving an account its own, strong password helps protect you and your information in that account. Start today by making sure your Google Account has a unique password.

2. Make your password hard to guess
“password.” “123456.” “My name is Inigo Montoya. You killed my father. Prepare to die!” These examples are terrible passwords because everyone knows them—including potential attackers. Making your passwords longer or more complicated makes them harder to guess for both bad guys and people who know you. We know it’s hard: the average password is shorter than 8 characters, and many just contain letters. In a database of 32 million real passwords that were made public in 2009, analysis showed (PDF) only 54 percent included numbers, and only 3.7 percent had special characters like & or $.

One way to build a strong password is to think of a phrase or sentence that other people wouldn’t know and then use that to build your password. For example, for your email you could think of a personal message like “I want to get better at responding to emails quickly and concisely” and then build your password from numbers, symbols, and the first letters of each word—“iw2gb@r2eq&c”. Don’t use popular phrases or lyrics to build your password—research suggests that people gravitate to the same phrases, and you want your password to be something only you know.

Google doesn’t restrict password length, so go wild!

3. Keep your password somewhere safe
Research shows (PDF) that worrying about remembering too many passwords is the chief reason people reuse certain passwords across multiple services. But don’t worry—if you’ve created so many passwords that it’s hard to remember them, it’s OK to make a list and write them down. Just make sure you keep your list in a safe place, where you won’t lose it and others won’t be able to find it. If you’d prefer to manage your passwords digitally, a trusted password manager might be a good option. Chrome and many web browsers have free password managers built into them, and there are many independent options as well—take a few minutes to read through reviews and see what would be best for your needs.

4. Set a recovery option

Have you ever forgotten your password? Has one of your friends ever been locked out of their account? Setting a recovery option, like an alternate email address or a telephone number, helps give the service provider another way to contact you if you are ever locked out of your account. Having an up-to-date recovery phone or email address is the best thing you can do to make sure you can get back into your account fast if there is ever a problem.

If you haven’t set a recovery option for your Google Account, add one now. If you have, just take a second to make sure it’s up to date.

We have more tips on how to pick a good password on our Help Center, and in the video below:

Your online safety and privacy is important to you, and it’s important to us, too. We’ve made a huge amount of progress to help protect your Google Account from people who want to break into it, but for the time being, creating a unique, strong password is still an important way to protect your online accounts. Please take five minutes today to reset your important passwords using the tips above, and stay tuned for more security tips throughout the summer.

Thursday, May 30, 2013

Investing in a South African solar project

As we search for investments that can help speed up the adoption of renewable energy, we’ve been looking beyond the U.S. and Europe to parts of the world where our investments can have an even greater impact. We’ve just closed our first investment in Africa: $12 million USD (103 million Rand) investment in the Jasper Power Project, a 96 megawatt solar photovoltaic plant in the Northern Cape province of South Africa. Upon completion, Jasper will be one of the largest solar installations on the continent, capable of generating enough electricity to power 30,000 South African homes. The project, developed and funded by SolarReserve, Intikon Energy and the Kensani Group, is also backed by Rand Merchant Bank, the Public Investment Corporation, Development Bank of South Africa and the PEACE Humansrus Trust.


View Jasper Power Project in a larger map
The Jasper Power Project is located in the Northern Cape Province of South Africa, near Postmasburg


When we consider investing in a renewable energy project, we focus on two key factors. First, we only pursue investments that we believe make financial sense. South Africa’s strong resources and supportive policies for renewable energy make it an attractive place to invest—which is why it had the highest growth in clean energy investment in the world last year. Second, we look for projects that have transformative potential—that is, projects that will bolster the growth of the renewable energy industry and move the world closer to a clean energy future. The Jasper Power Project is one of those transformative opportunities. To explain why, perhaps some background would be helpful.

Back in 2008, South Africa experienced a severe energy shortage, which resulted in blackouts throughout the country and slowed down economic growth. Since then the South African government has been actively supporting the growth of new sources of electricity to power the nation. While today South Africa is primarily dependent on fossil fuels, there’s lots of potential for renewable energy—it’s a country blessed with abundant wind and solar resources—and the government has set an ambitious goal of generating 18 gigawatts (GW) of renewable energy by 2030 (as a comparison, the entire South African grid is currently 44 GW).

To meet this goal, the South African government has established the Renewable Energy Independent Power Producer Procurement Program (REIPPPP). Through the program, renewable energy projects compete on the basis of cost and contribution to the local economy to be awarded a contract with Eskom, South Africa’s state-owned energy utility. Jasper and the other projects being developed through the REIPPPP have the potential to transform the South African energy grid. And given South Africa’s position as an economic powerhouse in Africa, a greener grid in South Africa can set an example for the whole continent.

Once constructed, the project will use solar panels like these.

Just as compelling are the economic and social benefits that the project will bring to the local community. Jasper will create approximately 300 construction and 50 permanent jobs in a region experiencing high rates of unemployment, as well as providing rural development and education programs and setting aside a portion of total project revenues—amounting to approximately $26 million over the life of the project—for enterprise and socio-economic development. We appreciate how forward-thinking the South African government has been in designing the REIPPPP to encourage these kinds of local economic benefits.

Google has committed more than $1 billion to renewable energy investments and we continue to search for new opportunities. Our search has brought us from the U.S. to Europe and now to Africa. We’re excited to see where else it might lead.

Open Access for Publications


The Association for Computing Machinery (ACM) recently announced a new option for publication rights management, wherein researchers can choose to pay for the public to have perpetual open access to the publication. Google applauds this new option, and today we are announcing that we will pay the open access fees for all articles by Google researchers that are published in ACM journals. IEEE also has an open access option for some of its publications, and we also pay the open access fee for them and for publications in like organizations.

Google has always believed that by improving access to the world’s knowledge, we can help improve everyone’s lives. When it comes to scientific research, we have consistently said that open access to publications speeds up research, accelerates innovation, and helps grow the global economy.

Policies like ACM’s continue to demonstrate the sustainability of open access publishing. It will also provide better access to the papers that we write at Google. We encourage researchers everywhere to pursue open access options whenever publishing articles, and to continue to make publications available as widely as possible, within your rights.

Wednesday, May 29, 2013

A new inbox that puts you back in control

We get a lot of different types of email: messages from friends, social notifications, deals and offers, confirmations and receipts, and more. All of these emails can compete for our attention and make it harder to focus on the things we need to get done. Sometimes it feels like our inboxes are controlling us, rather than the other way around.

But it doesn’t have to be that way. Today, Gmail is getting a brand new inbox on desktop and mobile that puts you back in control using simple, easy organization.

On the desktop, the new inbox groups your mail into categories which appear as different tabs. You simply choose which categories you want and voilà! Your inbox is organized in a way that lets you see what’s new at a glance and decide which emails you want to read when.


You can easily customize the new inbox—select the tabs you want from all five to none, drag-and-drop to move messages between tabs, set certain senders to always appear in a particular tab and star messages so that they also appear in the Primary tab.

In the Gmail for Android 4.0+ and Gmail for iPhone and iPad apps, you'll see your Primary mail when you open the app and you can easily navigate to the other tabs.
 

If the new inbox isn't quite your style, you can simply switch off all optional tabs to go back to classic view, or switch to any of your other favorite inbox types.

The new inbox is rolling out gradually. The desktop, Android and iOS versions will become available within the next few weeks. If you'd like to try out the new inbox on Desktop sooner, keep an eye on the gear menu and select Configure inbox when it appears in the Settings options.

Tuesday, May 28, 2013

Explore more with Mapping with Google


In September 2012 we launched Course Builder, an open source learning platform for educators or anyone with something to teach, to create online courses. This was our experimental first step in the world of online education, and since then the features of Course Builder have continued to evolve. Mapping with Google, our latest MOOC, showcases new features of the platform.

From your own backyard all the way to Mount Everest, Google Maps and Google Earth are here to help you explore the world. You can learn to harness the world’s most comprehensive and accurate mapping tools by registering for Mapping with Google.

Mapping with Google is a self-paced, online course developed to help you better navigate the world around you by improving your use of the new Google Maps, Maps Engine Lite, and Google Earth. All registrants will receive an invitation to preview the new Google Maps.

Through a combination of video and text lessons, activities, and projects, you’ll learn to do much more than look up directions or find your house from outer space. Tell a story of your favorite locations with rich 3D imagery, or plot sights to see on your upcoming trip and share with your travel buddies. During the course, you’ll have the opportunity to learn from Google experts and collaborate with a worldwide community of participants, via Google+ Hangouts and a course forum.

Mapping with Google will be offered from June 10 - June 24, and you can choose whether to explore the features of Google Maps, Google Earth, or both. In addition, you’ll have the option to complete a project, applying the skills you’ve learned to earn a certificate. Visit g.co/mappingcourse to learn more and register today.

The world is a big place; we like to think that you can make it a bit more manageable and adventurous with Google’s mapping tools.

Friday, May 24, 2013

Syntactic Ngrams over Time


We are proud to announce the release of a very large dataset of counted dependency tree fragments from the English Books Corpus. This resource will help researchers, among other things, to model the meaning of English words over time and create better natural-language analysis tools. The resource is based on information derived from a syntactic analysis of the text of millions of English books.

Sentences in languages such as English have structure. This structure is called syntax, and knowing the syntax of a sentence is a step towards understanding its meaning. The process of taking a sentence and transforming it into a syntactic structure is called parsing. At Google, we parse a lot of text every day, in order to better understand it and be able to provide better results and services in many of our products.

There are many kinds of syntactic representations (you may be familiar with sentence diagramming), and at Google we've been focused on a certain type of syntactic representation called "dependency trees". Dependency-trees representation is centered around words and the relations between them. Each word in a sentence can either modify or be modified by other words. The various modifications can be represented as a tree, in which each node is a word.

For example, the sentence "we really like syntax" is analyzed as:


The verb "like" is the main word of the sentence. It is modified by a subject (denoted nsubj) "we", a direct object (denoted dobj) "syntax", and an adverbial modifier "really".

An interesting property of syntax is that, in many cases, one could recover the structure of a sentence without knowing the meaning of most of the words. For example, consider the sentence "the krumpets gnorked the koof with a shlap". We bet you could infer its structure, and tell that group of something which is called a krumpet did something called "gnorking" to something called a "koof", and that they did so with a "shlap".

This property by which you could infer the structure of the sentence based on various hints, without knowing the actual meaning of the words, is very useful. For one, it suggests that a even computer could do a reasonable job at such an analysis, and indeed it can! While still not perfect, parsing algorithms these days can analyze sentences with impressive speed and accuracy. For instance, our parser correctly analyzes the made-up sentence above.


Let's try a more difficult example. Something rather long and literary, like the opening sentence of One hundred years of solitude by Gabriel García Márquez, as translated by Gregory Rabassa:

Many years later, as he faced the firing squad, Colonel Aureliano Buendía was to remember that distant afternoon when his father took him to discover ice.


Pretty good for an automatic process, eh?

And it doesn’t end here. Once we know the structure of many sentences, we can use these structures to infer the meaning of words, or at least find words which have a similar meaning to each other.

For example, consider the fragments:
"order a XYZ"
"XYZ is tasty"
"XYZ with ketchup"
"juicy XYZ"

By looking at the words modifying XYZ and their relations to it, you could probably infer that XYZ is a kind of food. And even if you are a robot and don't really know what a "food" is, you could probably tell that the XYZ must be similar to other unknown concepts such as "steak" or "tofu".

But maybe you don't want to infer anything. Maybe you already know what you are looking for, say "tasty food". In order to find such tasty food, one could collect the list of words which are objects of the verb "ate", and are commonly modified by the adjective "tasty" and "juicy". This should provide you a large list of yummy foods.

Imagine what you could achieve if you had hundreds of millions of such fragments. The possibilities are endless, and we are curious to know what the research community may come up with. So we parsed a lot of text (over 3.5 million English books, or roughly 350 billion words), extracted such tree fragments, counted how many times each fragment appeared, and put the counts online for everyone to download and play with.

350 billion words is a lot of text, and the resulting dataset of fragments is very, very large. The resulting datasets, each representing a particular type of tree fragments, contain billions of unique items, and each dataset’s compressed files takes tens of gigabytes. Some coding and data analysis skills will be required to process it, but we hope that with this data amazing research will be possible, by experts and non-experts alike.

The dataset is based on the English Books corpus, the same dataset behind the ngram-viewer. This time there is no easy-to-use GUI, but we still retain the time information, so for each syntactic fragment, you know not only how many times it appeared overall, but also how many times it appeared in each year -- so you could, for example, look at the subjects of the word “drank” at each decade from 1900 to 2000 and learn how drinking habits changed over time (much more ‘beer’ and ‘coffee’, somewhat less ‘wine’ and ‘glass’ (probably ‘of wine’). There’s also a drop in ‘whisky’, and an increase in ‘alcohol’. Brandy catches on around 1930s, and start dropping around 1980s. There is an increase in ‘juice’, and, thankfully, some decrease in ‘poison’).

The dataset is described in details in this scientific paper, and is available for download here.

Thursday, May 23, 2013

Capturing the beauty and wonder of the Galapagos on Google Maps

The Galapagos Islands are some of the most biologically unique ecosystems in the world. Explorers and scientists alike have long studied and marveled at these islands—made famous by Charles Darwin. The Ecuadorean Government, local conservation groups and scientists are working to protect the Galapagos from threats posed by invasive species, climate change and other human impacts.

It’s critical that we share images with the world of this place in order to continue to study and preserve the islands’ unique biodiversity. Today we’re honored to announce, in partnership with Charles Darwin Foundation (CDF) and the Galapagos National Parks Directorate (GNPD), that we’ve collected panoramic imagery of the islands with the Street View Trekker. These stunning images will be available on Google Maps later this year so people around the world can experience this remote archipelago.

Daniel Orellana of Charles Darwin Foundation crossing a field of ferns to reach Minas de Azufre (naturally-occurring sulfur mines) on the top of Sierra Negra, an active volcano on Isabela Island. The Google Maps team traveled for more than three hours, hiking and on horseback, to reach this remote location.

Images, like the one you see above, are also an important visual record that the CDF and GNPD will use to study and protect the islands by showing the world how these delicate environments have changed over time.

Daniel Orellana of the Charles Darwin Foundation climbs out of a lava tunnel where he was collecting imagery. The dramatic lava landscapes found on Isabela island tell the story of the formation of the Galapagos Islands.

Our 10-day adventure in the Galapagos was full of hiking, boating and diving around the islands (in hot and humid conditions) to capture 360-degree images of the unique wildlife and geological features of the islands with the Trekker. We captured imagery from 10 locations that were hand-selected by CDF and GNPD. We walked past giant tortoises and blue-footed boobies, navigated through steep trails and lava fields, and picked our way down the crater of an active volcano called Sierra Negra.


A Galapagos giant tortoise crawls along the path near Googler Karin Tuxen-Bettman while she collects imagery with the Street View Trekker in Galapaguera, a tortoise breeding center, which is managed by the Galapagos National Park Service.

Life underwater in the Galapagos is just as diverse as life on land. We knew our map of the islands wouldn’t be comprehensive without exploring the ocean that surrounds them. So for the second time we teamed up with the folks at the Catlin Seaview Survey to collect underwater panoramic imagery of areas being studied by CDF and GNPD. This imagery will be used by Catlin Seaview Survey to create a visual and scientific baseline record of the marine environment surrounding the islands, allowing for any future changes to be measured and evaluated by scientists around the world.

Christophe Bailhache navigates the SVII camera through a large group of Sea Lions at Champion Island in Galapagos. Image courtesy of the Catlin Seaview Survey.

We truly believe that in order to protect these Galapagos Islands, we must understand them. As they say, “a picture is worth a thousand words.” We hope this Street View imagery not only advances the important scientific research, but also inspires you to learn more about this special place. Stay tuned for updates on this collection—the first time we’ve captured imagery from both land and sea! We can’t wait to share this amazing imagery with you later this year.

Wednesday, May 22, 2013

“Coming Home” by Wisconsin student wins U.S. 2013 Doodle 4 Google competition

After 130,000 submissions and millions of votes cast, Sabrina Brady of Sparta, Wisc. has been named the 2013 U.S. Doodle 4 Google National Winner. Her doodle, “Coming Home,” will be featured on the Google homepage in the U.S. tomorrow, May 23.

Students across all 50 states amazed us with their creative interpretations of this year’s theme, “My Best Day Ever...” From scuba diving to dinosaurs to exploring outer space, we were wowed by the ways young artists brought their best days to life in their doodles.

Sabrina’s doodle stood out in the crowd; it tells the story of her reunion with her father as he returned from an 18 month deployment in Iraq. Her creative use of the Google letters to illustrate this heartfelt moment clearly resonated with voters across the country and all of us at Google.

In addition to seeing her artwork on the Google homepage, Sabrina—who is in 12th grade at Sparta High School—will receive a $30,000 college scholarship, a Chromebook computer and a $50,000 technology grant for her school. She will attend Minneapolis College of Art and Design this coming fall, where she will continue her artistic pursuits. Congratulations Sabrina!


In addition to the National Winner, voters across the country helped us determine the four National Finalists, who will each receive a $5,000 college scholarship:
  • Grades K-3: Reagan Gonsalves (Grade 1, Santan Elementary School, Chandler, Ariz.) for her doodle “My best day ever is learning about nature.” Reagan says, “My best day ever is to be around the pretty animals and plants in nature, because I love to know about what is around me. I love to watch hummingbirds drink nectar out of flowers. I love to read books on nature and how plants and animals grow.”
  • Grades 4-5: Audrey Zhang (Grade 4, Michael F. Stokes Elementary School, Levittown, N.Y.) for her doodle “...When I discover paradise!” Zhang says, “My best day ever will be when I discover paradise. In paradise, I could play with dragons, romp with leopards, and chat with fairies...It would be the best day ever when I could finally live in a mystical, dreamy realm.”
  • Grades 6-7: Maria Iannone (Grade 7, Chestnut Ridge Middle School, Sewell, N.J.) for her doodle “The best day ever.” Maria says, “Where I live, it's difficult to view the night sky very well. Having an interest in astronomy, a day where I can observe the things I study on my own time would satisfy me.”
  • Grades 8-9: Joseph Han (Grade 8, Falmouth Middle School, Falmouth, Maine) for his doodle “Late-afternoon bliss.” Joey says, “For me, ‘the best day ever’ doesn't consist of ambitious dreams, but rather the enjoyment of a day spent in carefree euphoria. Being in the woods is something that evokes such happiness in me. The lighthearted joy of rafting, fishing or catching fireflies is what I've attempted to capture.”

After the awards ceremony, all 50 of our State Winners will unveil a special exhibition of their artwork at the American Museum of Natural History in New York City, where their doodles will be displayed for the public to view from May 22 - July 14.

Thanks to all who voted and helped us select the 2013 Doodle 4 Google winners. Even more importantly, thank you to all of the students who submitted their artwork and the parents and teachers who continue to inspire and support their young artists. Until next year... happy doodling!

Top Charts in Google Trends—The most searched people, places and things

Ever wonder what the world is searching for? With Google Trends, you can see what's hot right now, and also explore the history and geography of a topic as it evolves. Today you'll find new charts of the most-searched people, places and things in more than 40 categories, from movies to sports teams to tourist attractions. You'll also find a new colorful visualization of real-time Hot Searches.

Top Charts—a new monthly "spirit of the times"
Top Charts are lists of real-world people, places and things ranked by search interest. They show information similar to our Year-End Zeitgeist, but updated monthly and going back to 2004. To check them out, go to Google Trends and click "Top Charts" on the left-hand side. For example, you can see the 10 most-searched cities, movies and scientists in April:

Top Charts includes more than 40 top 10 lists and more than 140 time periods. Hover on a chart for links to embed the chart in your own page or share on social media.

Top Charts is built on the Knowledge Graph, so the data shows interest in real-world things, not just keywords. When you look at a chart of sports teams and you see the Golden State Warriors, those rankings are based on many different related searches, like [gs warriors], [golden state bball] and [warriors basketball]. That way you see which topics are most popular on Google Search, however people search for them. Top Charts provide our most accurate search volume rankings, but no algorithm is perfect, so on rare occasion you may find anomalies in the data. You can learn more about Top Charts in our Help Center.

Hot Searches, now in hot colors
In addition to Top Charts, now there's a vibrant new way to visualize trending searches as they happen. On the Trends homepage in the left-hand panel, you'll find a new link to "Visualize Hot Searches in full-screen." You’ll see the latest trending topics appear in a colorful display:


You can customize the layout by clicking the icon in the upper-left corner and expanding it to see as many as 25 searches at a time. You can also pick any region currently supported by Hot Searches. Use fullscreen mode in your browser for the biggest, purest eye candy.

...and a few design updates
We’re also continuing to spruce up our site. Among other things, now the homepage shows you more interesting stuff up front, and the search box is always available at the top:

The new Trends homepage shows a list of today's Hot Searches. Enter search terms at the top to see search interest over time and by geography.

We hope you enjoy bringing new stories to life with Google Trends. We love feedback, so please feel free to let us know what you think by posting online or by clicking "Send Feedback" at the bottom of any page in Google Trends.

Congratulations to the 2013 Google Anita Borg Memorial Scholars

Dr. Anita Borg revolutionized the way we think about technology and worked to dismantle the barriers that keep women and minorities from entering the computing and technology fields. In her lifetime, Anita founded the Institute for Women and Technology (now The Anita Borg Institute for Women and Technology), began an online community called Systers for technical women, and co-founded the Grace Hopper Celebration of Women in Computing. We’re proud to honor her memory through the Google Anita Borg Memorial Scholarship, established in 2004.

Today we’d like to recognize and congratulate the 30 Google Anita Borg Memorial scholars and the 30 Google Anita Borg Memorial finalists for 2013. The scholars, who attend universities in the United States and Canada, will join the annual Google Scholars’ Retreat this summer in New York City, where they will have the opportunity to attend tech talks on Google products, network with other scholars and Googlers, participate in developmental activities and sessions, and attend social activities. This year, the scholars will also have the opportunity to participate in a scholars’ edition of 24HoursOfGood, a hackathon in partnership with local non-profit organizations who work on education and STEM initiatives to make progress against a technical problem that is critical to their organization’s success.

Find out more (PDF) about our winners, including the institutions they attend. Soon we’ll select the Anita Borg scholars from our programs around the world. For more information on all our scholarships, visit the Google Scholarships site.

Tuesday, May 21, 2013

Mario Testino to "The Scream" via Mark Rothko

Every day on the Art Project Google+ page we post a snippet of information about a painting, an artist or a talk—and every day, at least one of our 4 million followers has something to say in response. We’re constantly delighted by how the appetite for art online is growing and today we have a veritable feast in store with a swathe of fresh artworks, gigapixel paintings and museums on Street View.

New artworks from the famous to the unusual
Mario Testino is a world-famous photographer, known for his work in the fashion industry. Fewer people are aware of his photographs focusing on the culture of his native Peru. A new body of photographs called “Alta Moda” (high fashion), featuring Andean people in traditional and festive dress, is currently on display in Testino’s cultural institution, MATE. And for those of you not lucky enough to visit Lima, you can now see this collection of 27 photos online on the Google Art Project.


In total, we have more than 1,500 new high-resolution artworks including masterpieces such as Monet’s “Waterlilies,” Rembrandt’s “Portrait of a Man in a Broad-Brimmed Hat” and Johannes Vermeer’s “The Geographer” (meaning Art Project now houses 15 of his 34 total works, all contributed by different museums). However, the diversity goes well beyond paintings; from ancestral relics used to worship the dead to an ancient Jinsha gold mask from China thought to have been worn by sorcerers. Often the old contrasts with the new, with inscribed Arabic gemstones existing alongside contemporary glass structures from Germany as you can see in this “Compare” image below.


Zoom in to “gigapixel” paintings
Gigapixel paintings—very high-resolution works which enable you to zoom in at brushstroke level—have long been at the heart of the Art Project. They’re a great example of the magic that can happen when technology meets art—and today we have 16 new ones to add, ranging from famous pieces like “The Scream” by Edvard Munch to those chosen by public vote such as “Whitewashing the Old House” by L.A. Ring.

The beauty of gigapixels is their ability to surprise. Look at the painting “Fra Stalheim” by Johan Christian Dahl, shown in full on the left below. You’ll see a beautiful landscape. Zoom in, however, and you discover scenes within a scene—a village with smoking chimneys, a woman tending to her child, and cows grazing on the hillside. Details that can’t always be fully appreciated by the naked eye are brought to life online.


Immerse yourself in Street View
Through Street View and the Google Art Project, many museums have opened their galleries to the world the past few years, and today we’re launching 20 more. For example, Fondation Beyeler Museum in Switzerland houses a collection of seven Mark Rothko paintings. Now anyone in the world can virtually explore the collection.


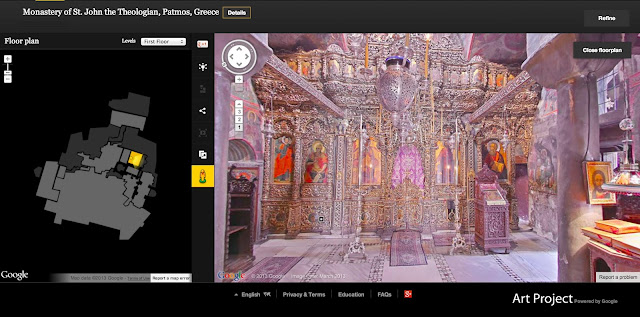
Of course art collections are not exclusively found in museums—we’re delighted to have our first monastery on Street View in the Art Project. The Monastery of St. John the Theologian on the Greek island of Patmos was founded in 1088 and is a World Heritage Site. In addition to their 116 contributed artworks, you can also explore the architectural splendors of this ancient building.


Jump inside a whole range of beautiful buildings and corridors here by clicking on the orange pegman where it appears.

In a week that celebrates International Museum Day, we’re glad to be able to showcase some of the great treasures held by museums and cultural institutions the world over. There are so many benefits to bringing more content online, be it discovering a new style of art or artist, creating your own gallery, stumbling across a hidden detail of a painting you thought you knew or simply being inspired by something beautiful. With more than 40,000 total works and 250+ cultural organisations around the globe, we hope the experience will be more enriching than ever.

Thursday, May 16, 2013

Launching the Quantum Artificial Intelligence Lab


We believe quantum computing may help solve some of the most challenging computer science problems, particularly in machine learning. Machine learning is all about building better models of the world to make more accurate predictions. If we want to cure diseases, we need better models of how they develop. If we want to create effective environmental policies, we need better models of what’s happening to our climate. And if we want to build a more useful search engine, we need to better understand spoken questions and what’s on the web so you get the best answer.

So today we’re launching the Quantum Artificial Intelligence Lab. NASA’s Ames Research Center will host the lab, which will house a quantum computer from D-Wave Systems, and the USRA (Universities Space Research Association) will invite researchers from around the world to share time on it. Our goal: to study how quantum computing might advance machine learning.

Machine learning is highly difficult. It’s what mathematicians call an “NP-hard” problem. That’s because building a good model is really a creative act. As an analogy, consider what it takes to architect a house. You’re balancing lots of constraints -- budget, usage requirements, space limitations, etc. -- but still trying to create the most beautiful house you can. A creative architect will find a great solution. Mathematically speaking the architect is solving an optimization problem and creativity can be thought of as the ability to come up with a good solution given an objective and constraints.

Classical computers aren’t well suited to these types of creative problems. Solving such problems can be imagined as trying to find the lowest point on a surface covered in hills and valleys. Classical computing might use what’s called “gradient descent”: start at a random spot on the surface, look around for a lower spot to walk down to, and repeat until you can’t walk downhill anymore. But all too often that gets you stuck in a “local minimum” -- a valley that isn’t the very lowest point on the surface.

That’s where quantum computing comes in. It lets you cheat a little, giving you some chance to “tunnel” through a ridge to see if there’s a lower valley hidden beyond it. This gives you a much better shot at finding the true lowest point -- the optimal solution.

We’ve already developed some quantum machine learning algorithms. One produces very compact, efficient recognizers -- very useful when you’re short on power, as on a mobile device. Another can handle highly polluted training data, where a high percentage of the examples are mislabeled, as they often are in the real world. And we’ve learned some useful principles: e.g., you get the best results not with pure quantum computing, but by mixing quantum and classical computing.

Can we move these ideas from theory to practice, building real solutions on quantum hardware? Answering this question is what the Quantum Artificial Intelligence Lab is for. We hope it helps researchers construct more efficient and more accurate models for everything from speech recognition, to web search, to protein folding. We actually think quantum machine learning may provide the most creative problem-solving process under the known laws of physics. We’re excited to get started with NASA Ames, D-Wave, the USRA, and scientists from around the world.

Live from Google I/O: Mo’ screens, mo’ goodness

This morning, we kicked off the 6th annual Google I/O developer conference with over 6,000 developers at Moscone Center in San Francisco, 460 I/O Extended sites in 90 countries, and millions of you around the world who tuned in via our livestream. Over the next three days, we’ll be hosting technical sessions, hands-on code labs, and demonstrations of Google's products and partners' technology.

We believe computing is going through one of the most exciting moments in its history: people are increasingly adopting phones, tablets and newer type of devices. And this spread of technology has the potential to make a positive impact in the lives of people around the world—whether it's simply helping you in your daily commute, or connecting you to information that was previously inaccessible.

This is why we focus so much on our two open platforms: Android and Chrome. They enable developers to innovate and reach as many people as possible with their apps and services across multiple devices. Android started as a simple idea to advance open standards on mobile; today it is the world’s leading mobile platform and growing rapidly. Similarly, Chrome launched less than five years ago from an open source project; today it’s the world’s most popular browser.

In line with that vision, we made several announcements today designed to give developers even more tools to build great apps on Android and Chrome. We also shared new innovations from across Google meant to help make life just a little easier for you, including improvements in search, communications, photos, and maps.

Here’s a quick look at some of the announcements we made at I/O:

  • Android & Google Play: In addition to new developer tools, we unveiled Google Play Music All Access, a monthly music subscription service with access to millions of songs that joins our music store and locker; and the Google Play game services with real-time multiplayer and leaderboards. Also, coming next month to Google Play is a special Samsung Galaxy S4, which brings together cutting edge hardware from Samsung with Google’s latest software and services—including the user experience that ships with our popular Nexus devices.
  • Chrome: With over 750 million active users on Chrome, we’re now focused on bringing to mobile the speed, simplicity and security improvements that we’ve seen on the desktop. To that end, today we previewed next-generation video codec VP9 for faster video-streaming performance; the requestAutocomplete API for faster payments; and Chrome Experiments such as "A Journey Through Middle Earth" and Racer to demonstrate the ability to create immersive mobile experiences not possible in years past.
  • Google+: We unveiled the newly designed Google+, which helps you easily explore content as well dramatically improve your online photo experience to give you crisp, beautiful photos—without the work! We also upgraded Google+ Hangouts—our popular group video application—to help bring all of your real-life conversations online, across any device or platform, and with groups of up to 10 friends.
  • Search: Search has evolved considerably in recent years: it can now have a real conversation with you, and even make your day a bit smoother by predicting information you might need. Today we added the ability to set reminders by voice and we previewed “spoken answers” on laptops and desktops in Chrome—meaning you can ask Google a question and it will speak the answer back to you.
  • Maps: Today we previewed the next generation of Google Maps, which gets rid of any clutter in order to put your individual experience and exploration front and center. Each time you click or search, our technology draws you a tailored map that highlights the information you need. From design to directions, the new Google Maps is smarter and more useful.

Technology can have a profound, positive impact on the daily lives of billions of people. But we can’t do this alone—developers play a crucial role. I/O is our chance to come together and thank you for everything you do.

Thursday, May 9, 2013

A picture of Earth through time

Today, we're making it possible for you to go back in time and get a stunning historical perspective on the changes to the Earth’s surface over time. Working with the U.S. Geological Survey (USGS), NASA and TIME, we're releasing more than a quarter-century of images of Earth taken from space, compiled for the first time into an interactive time-lapse experience. We believe this is the most comprehensive picture of our changing planet ever made available to the public.

Built from millions of satellite images and trillions of pixels, you can explore this global, zoomable time-lapse map as part of TIME's new Timelapse project. View stunning phenomena such as the sprouting of Dubai’s artificial Palm Islands, the retreat of Alaska’s Columbia Glacier, the deforestation of the Brazilian Amazon and urban growth in Las Vegas from 1984 to 2012:


Feel free to share these GIFs! More examples can be found on Google+.

The images were collected as part of an ongoing joint mission between the USGS and NASA called Landsat. Their satellites have been observing earth from space since the 1970s—with all of the images sent back to Earth and archived on USGS tape drives that look something like this example (courtesy of the USGS).

We started working with the USGS in 2009 to make this historic archive of earth imagery available online. Using Google Earth Engine technology, we sifted through 2,068,467 images—a total of 909 terabytes of data—to find the highest-quality pixels (e.g., those without clouds), for every year since 1984 and for every spot on Earth. We then compiled these into enormous planetary images, 1.78 terapixels each, one for each year.

As the final step, we worked with the CREATE Lab at Carnegie Mellon University, recipients of a Google Focused Research Award, to convert these annual Earth images into a seamless, browsable HTML5 animation. Check it out on Google’s Timelapse website.

Much like the iconic image of Earth from the Apollo 17 mission—which had a profound effect on many of us—this time-lapse map is not only fascinating to explore, but we also hope it can inform the global community’s thinking about how we live on our planet and the policies that will guide us in the future. A special thanks to all our partners who helped us to make this happen.

We’re going live from Google I/O

Developers today have the power to introduce powerful, breakthrough technologies to the world through their code. That’s why we look forward to bringing Google developers together year after year at Google I/O, our annual developer conference. In one week, we’ll welcome more than 6,000 developers to I/O through the doors of Moscone West Convention Center in San Francisco, Calif.—and many more via our event’s live streams. If you’re looking for inspiration and want to learn more about the future of our products, we hope you’ll tune in to our live keynote and technical sessions.


Starting on May 15 at 9 a.m. PT (16:00 UTC), join us as Google Developers Live (GDL) powers multiple channels of live streamed content from Google I/O on developers.google.com/io. On this page, you can:

  • Stream the keynote on your computer, tablet or phone. Get in on the action, and listen to product and technology announcements straight from our teams. Live streaming will run on developers.google.com/io from 9 a.m. PT (16:00 UTC) to 7 p.m. PT (2:00 UTC) on May 15 and 16.
  • Watch exclusive interviews with the Googlers behind the latest product announcements. This year, GDL will broadcast one-on-one product deep dives, executive interviews and Developer Sandbox walkthroughs from our onsite stage.
  • Get the latest news in real time. We’ll post official announcements during I/O. You’ll be able to see the feed on the Google I/O homepage, in the I/O mobile app (coming soon), and on +Google Developers.
  • Never miss a session. The keynote and all sessions will be recorded and made rapidly available on GDL and the Google Developers YouTube channel.

Whether you’re joining us from the comfort of home for Google Developers Live at I/O or at an I/O Extended event, tune into developers.google.com/io at 9 a.m. PT (16:00 UTC) on May 15 for the latest from Google product teams. Add +Google Developers to your circles and follow #io13 to stay updated on official conference announcements and connect with the community.

Wednesday, May 8, 2013

More than 70 of the world’s languages in the blink of an eye

If you took a quick snapshot of content available on the web, you might think that everyone around the world spoke English, Chinese, French or Spanish. But in fact, millions of people around the world speak an incredible array of languages that currently have a small presence across the web.

Google Translate helps bridge the divide between the content available online and people’s ability to access that information. Starting today, you can translate another five languages using Google, which combined are spoken by more than 183 million people around the globe:

  • Bosnian is an official language in Bosnia and Herzegovina that’s also spoken in regions of neighboring countries and by diaspora communities around the world.
  • Cebuano is one of the languages spoken in the Philippines, predominantly in the middle (Visayas) and southern (Mindanao) regions of the nation.
  • You can hear the Hmong language spoken in many countries across the world, including China, Vietnam, Laos, Thailand and throughout the United States.
  • Javanese is the second most-spoken language in Indonesia (behind Indonesian), with 83 million native speakers.
  • Marathi is spoken in India and has 73 million native speakers. Google Translate already supports several other Indian languages: Bengali, Gujarati, Hindi, Kannada, Tamil, Telugu and Urdu.

With the exception of Bosnian, these new languages are “alpha,” meaning while the quality isn’t perfect, we will continue to test and improve them over time.


You can access Translate via the web at https://translate.google.com, on your Android or iOS device, or via Chrome and in Gmail. We're excited to reach the 70+ language milestone, and we look forward to continuing to add more languages.

Bosnian: Google Prevodilac sada podržava više od 70 jezika!
Cebuano: Google sa Translate misuporta na karon sa kapin sa 70 ka mga!
Hmong: Google Translate nim no txhawb nqa tshaj li 70 hom lus!
Javanese: Google Translate saiki ndhukung luwih saka 70 basa!
Marathi: Google भाषांतर आता 70 पेक्षा जास्त भाषांचे समर्थन करते!

Tuesday, May 7, 2013

Here's to the moms: Celebrate Mother's Day with Google

As both a daughter and a mom, Mother’s Day gives me the opportunity to tell my mom how much I appreciate, respect and admire her. It also reminds me to aspire to do my best for my own kids, just as my mom did for me. My best almost always begins with a hug.

As families search for new ways to make the most important women in their lives feel extra special, we have some suggestions to help you celebrate your mom, or another great mom in your life.

Visit our special page for Mother’s Day for gift ideas, to find local flower delivery options, and for tips on how to stay connected—and to just say “thank you.”


We also encourage you to share your favorite photo or video of mom (or a note to mom) and tag your post with #HeresToTheMoms.

Starting this week, you can also tune in to Mother's Day Google+ Hangouts from +AskMen, featuring editors from +Parenting.com that will provide you with creative ideas about how to make this a day your mom won’t forget. Join the Mother’s Day Guide Google+ community to ask questions and hear what others are planning.

From all of us at Google, we wish moms everywhere a happy Mother’s Day!

Monday, May 6, 2013

Marking a cultural shift in computing with EDSAC

Computing’s early days are full of stories about great technical leaps forward.  But sometimes what matters most isn’t a shift in technology so much as a change in the way it is used.  The “Electronic Delay Storage Automatic Calculator” (EDSAC)—64 years old today—is a stellar example.

Entry from log book marking the first day that EDSAC was in operation: “May 6th 1949.  Machine in operation for first time. Printed a table of squares (0-99), time for programme 2 mins, 35 sec. Four tanks of battery 1 in operation”. Reproduced with kind permission of Computer Laboratory, University of Cambridge


EDSAC is noteworthy for marking the transition from “test to tool” in civilian computing.  Maurice Wilkes, EDSAC’s designer, sought to build a multi-purpose, reliable workhorse that would bring unrivalled calculating power to University of Cambridge researchers.  His aim wasn’t to be at the cutting edge of engineering; rather to be at the forefront of delivering a computer-powered general calculation service.  Above all else, Wilkes wanted EDSAC to be a practical computer, useful and accessible to a wide range of researchers.   


Short film celebrating the work of EDSAC’s team, led by Maurice Wilkes, produced by Google

In May 1949 EDSAC became the world’s first general purpose stored program computer to enter regular service, transforming scientific research at the University of Cambridge by making it possible to speedily tackle analyses of previously impractical scale, across disciplines as varied as astronomy, economics, biology and more.

But EDSAC’s legacy stretches far further. Subroutines—a central tenet of programming today—were invented by David Wheeler to make it easier to program EDSAC by re-using lines of existing code. The world’s first computer science diploma had EDSAC as its foundation. The world’s first business computer was built with EDSAC as a prototype.

Sadly, little remains physically of EDSAC today. That’s why a team of U.K. volunteers have embarked on an ambitious project to construct a working replica of the original EDSAC, in partnership with The National Museum of Computing. We’re delighted to support the EDSAC Rebuild Project, and we look forward to welcoming it back to regular service—as a reminder of the U.K.’s illustrious computing past.

Friday, May 3, 2013

Bridging the gaps with Street View

Recently we sent our Street View cars driving through the historic seaport town of Kaliningrad (the modern name for Koenigsberg) in Russia as part of our quest to keep Google Maps comprehensive, accurate and useful. While there, we were reminded of a classic mathematical problem: the Seven Bridges of Koenigsberg.

The mathematical problem posed an interesting challenge: find a route through Kaliningrad—which was once separated by the Pregel River—by crossing each of the seven bridges in town. The catch? One could only cross each bridge exactly once.

This sketch shows the town’s original seven bridges in green (Source: Wikipedia)

In 1735, Leonhard Euler, one of the most prolific mathematicians of all time and our recent Doodle subject, concluded that there was no solution to the problem because it was impossible to find a route that would cross each bridge only once. This famous problem and Leonhard Euler’s non-resolution paved the way for important discoveries in the field of mathematics including graph theory and topology.

Fast forward 278 years to today where we still rely on Euler’s findings to calculate optimal driving routes for our Street View cars. We use sophisticated algorithms, based on graph theory, to determine the best route through a city or town—helping us capture all the images we need in the shortest amount of time. Though these algorithms are complex, in simple terms, it's equivalent to solving the problem of drawing a house without lifting your pen and never going over the same segment twice. Like this:

(Source: Vincent Furnon, Google Operations Research Team)

While the bridges of Koeningsberg may be one of Kaliningrad’s most famous landmarks, you can also explore other parts of this historic town with Street View—including the oldest building in the city, the Juditten Church, which was built before 1288, and King’s Gate, one of the city’s original six gates built during the 19th century.


Today, it’s traditional for newly married couples to hang engraved padlocks on one of the original seven bridges of Koenigsberg

In other words, leave the mathematics to the mathematicians and just enjoy the scenery with Street View!

Wednesday, May 1, 2013

The 2013 Doodle 4 Google state winners are in and it’s time for you to vote!

Students from across the country sent in more than 130,000 doodles for our 2013 U.S. Doodle 4 Google competition. Today, we’re proud to share with you our 50 amazingly talented state winners. Exploring their “Best Day Ever...” from life down under to flying from planet to planet in outer space, we were wowed by the imaginations and talent of young aspiring artists from coast to coast.

To reveal the local winners in all 50 states, we’ve sent Googlers to their schools, where they’re celebrating the winning artists along with their parents, classmates, teachers and friends.

Now it’s time to make your voice heard. Starting today and through May 10, we’re inviting the public to vote for their favorite doodle from each of the five different grade groups. Your votes will determine the five national finalists, from which the national winner will be selected and announced at our May 22 awards ceremony in New York City.


We’ll display the winning doodle on the Google homepage on May 23 for millions to see. In addition, you’ll be able to see all 50 doodles created by our state winners in person at a special exhibition at the American Museum of Natural History in New York City from May 22 to July 14.

We’d like to send a special thank you to the parents, teachers and administrators who supported young artists and helped students across the country bring their “Best Day Ever” to life. We’ve loved looking at each and every entry that came in this year, and we hope you all enjoy the talent and creativity these 50 students have shared with us.